Your brain is passing electrical signals called action potentials along axonal fiber tract bundles more or less just like this right now (this is not a representation of biophoton activity although a lot of that activity would accompany your neuroelectric action potentials like these). This Glass Brain video from the Gazzaley Lab / Neuroscape lab, UCSF and the Swartz Center for Computational Neuroscience, UCSD is a realistic representation of typical electrical activity in real time in a human brain.
“This is an anatomically-realistic 3D brain visualization depicting real-time source-localized activity (power and “effective” connectivity) from EEG (electroencephalographic) signals. Each color represents source power and connectivity in a different frequency band (theta, alpha, beta, gamma) and the golden lines are white matter anatomical fiber tracts. Estimated information transfer between brain regions is visualized as pulses of light flowing along the fiber tracts connecting the regions.”
(Cerebral ventricles shown in blue below)
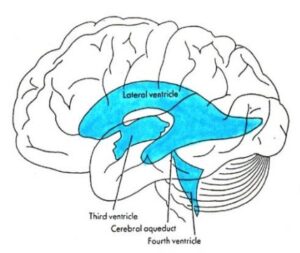
Observe that the greatest activity in the Glass Brain video is going on deep in the brain, below most of the cerebral cortex and in close association with where the cerebral ventricles should be, the fluid-filled spaces in the brain where Nexus Theory says consciousness actually occurs, shown above in blue. With this beginning mental picture in your mind, we will help you understand the physical mechanisms through which Nexus Theory works to do this.